Cadences
Radio SETI observations are often taken as part of a cadence, with repeated observations in a target direction. The order of observations is often described using a sequence of letters, like “ABACAD” or “ABABAB”, to indicate which pointings are unique.
setigen provides the Cadence object to organize multiple frames. This allows
you to inject signals into multiple frames in one step, for example.
You can either create an empty Cadence and add frames to it later or initialize the object with a list of frames:
c = stg.Cadence()
c.append(stg.Frame(...))
c.append(stg.Frame(...))

c = stg.Cadence(frame_list=[stg.Frame(...), stg.Frame(...)])
The Cadence object doesn’t have an imposed order; it serves as a bare-bones organizational structure for frames. If you would like to impose an order, use the OrderedCadence:
c = stg.OrderedCadence(frame_list,
                       order="ABACAD")
The OrderedCadence adds an order_label field to each frame’s metadata,
tracking the unique pointings.
Cadence objects supports Python list operations, such as append and slicing. In
addition, OrderedCadences can be filtered by order labels with
by_label(), which returns the appropriate
frames as a new Cadence object.
You can execute functions on each frame in a cadence using
apply(). This can be used, for example, to add
noise to each frame:
c.apply(lambda fr: fr.add_noise(4e6))
For convenience, cadences also have add_signal(),
which passes all arguments through to add_signal(), but
adjusts the times used in the signal calculation appropriately.
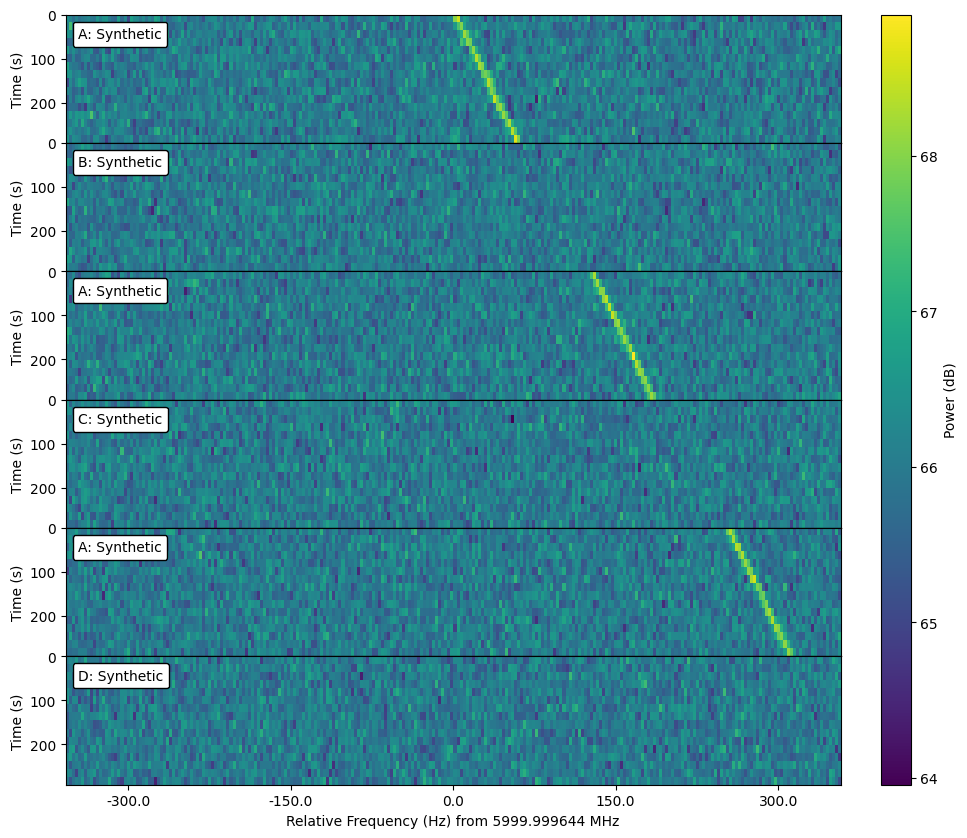
As an example, if you wanted to add a drifting signal only to “A” observations:
c.by_label("A").add_signal(stg.constant_path(f_start=c[0].get_frequency(index=128),
                               drift_rate=0.2*u.Hz/u.s),
                           stg.constant_t_profile(level=c[0].get_intensity(snr=30)),
                           stg.sinc2_f_profile(width=2*c[0].df*u.Hz),
                           stg.constant_bp_profile(level=1),
                           doppler_smearing=True)
fig = plt.figure(figsize=(10, 10))
c.plot()
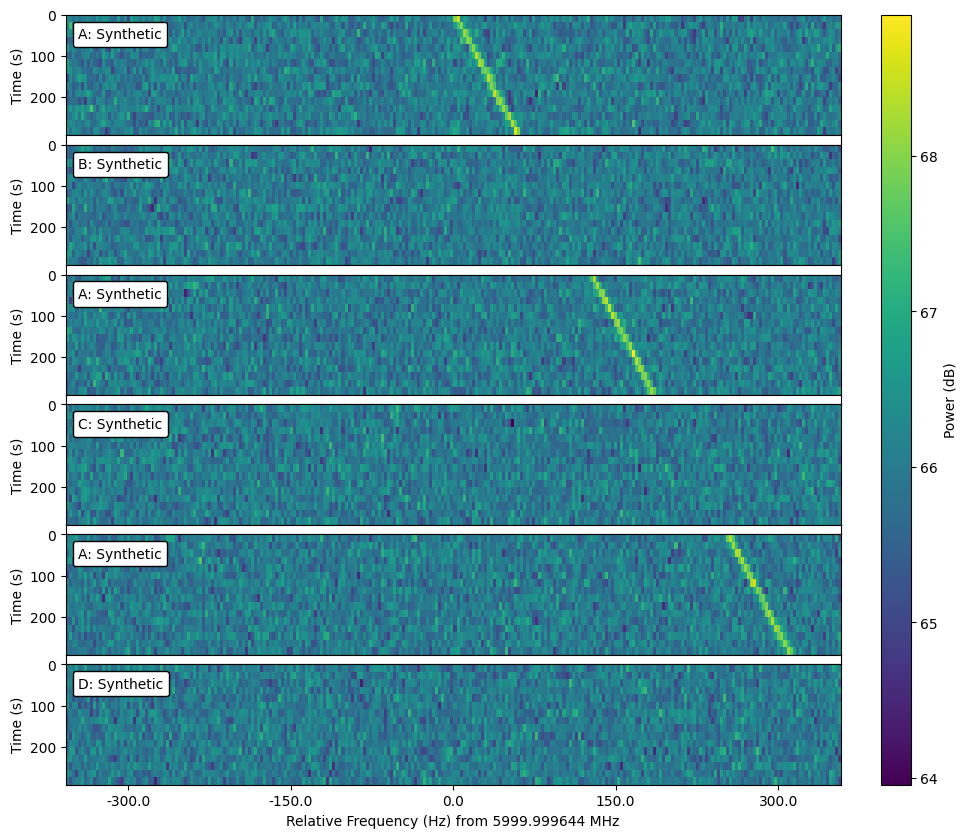
Cadence plotting has similar arguments to frame plotting, but you can also
have the subplots spaced out vertically in proportion to the slew time in
between observations by setting slew_times=True.
fig = plt.figure(figsize=(10, 10))
c.plot(slew_times=True)
These examples are using fully synthetic frames, but the cadence frames can just as easily use observational data, as long as the resolutions and frequency extent match.